> ## Documentation Index
> Fetch the complete documentation index at: https://docs.tilt.io/llms.txt
> Use this file to discover all available pages before exploring further.
# Create a dashboard
> Build a saved dashboard with Tilt Agent and reopen it from Library with current data.
A dashboard is a saved view that runs again when you open it, so it shows current data each time. This guide builds a read-only Market Session Checklist. Each run checks the time against the regular US-equities weekday session.
## 1. Ask for a dashboard
Select **New dashboard** in **Library > Dashboards** to start a request in chat, or ask Tilt Agent directly. Describe the changing data, the sections you need, and what the dashboard must not do.
```text theme={null}
Build and save a dashboard called Market Session Checklist.
Each time it runs, show whether the current time falls inside
the regular US-equities weekday session of 9:30 AM to 4:00 PM
Eastern. State that this does not confirm holidays, early closes,
or unscheduled closures. Follow it with a concise read-only
checklist for reviewing cash, allocation drift, and proposals
awaiting review. Make missing data explicit. Save it to Library.
```
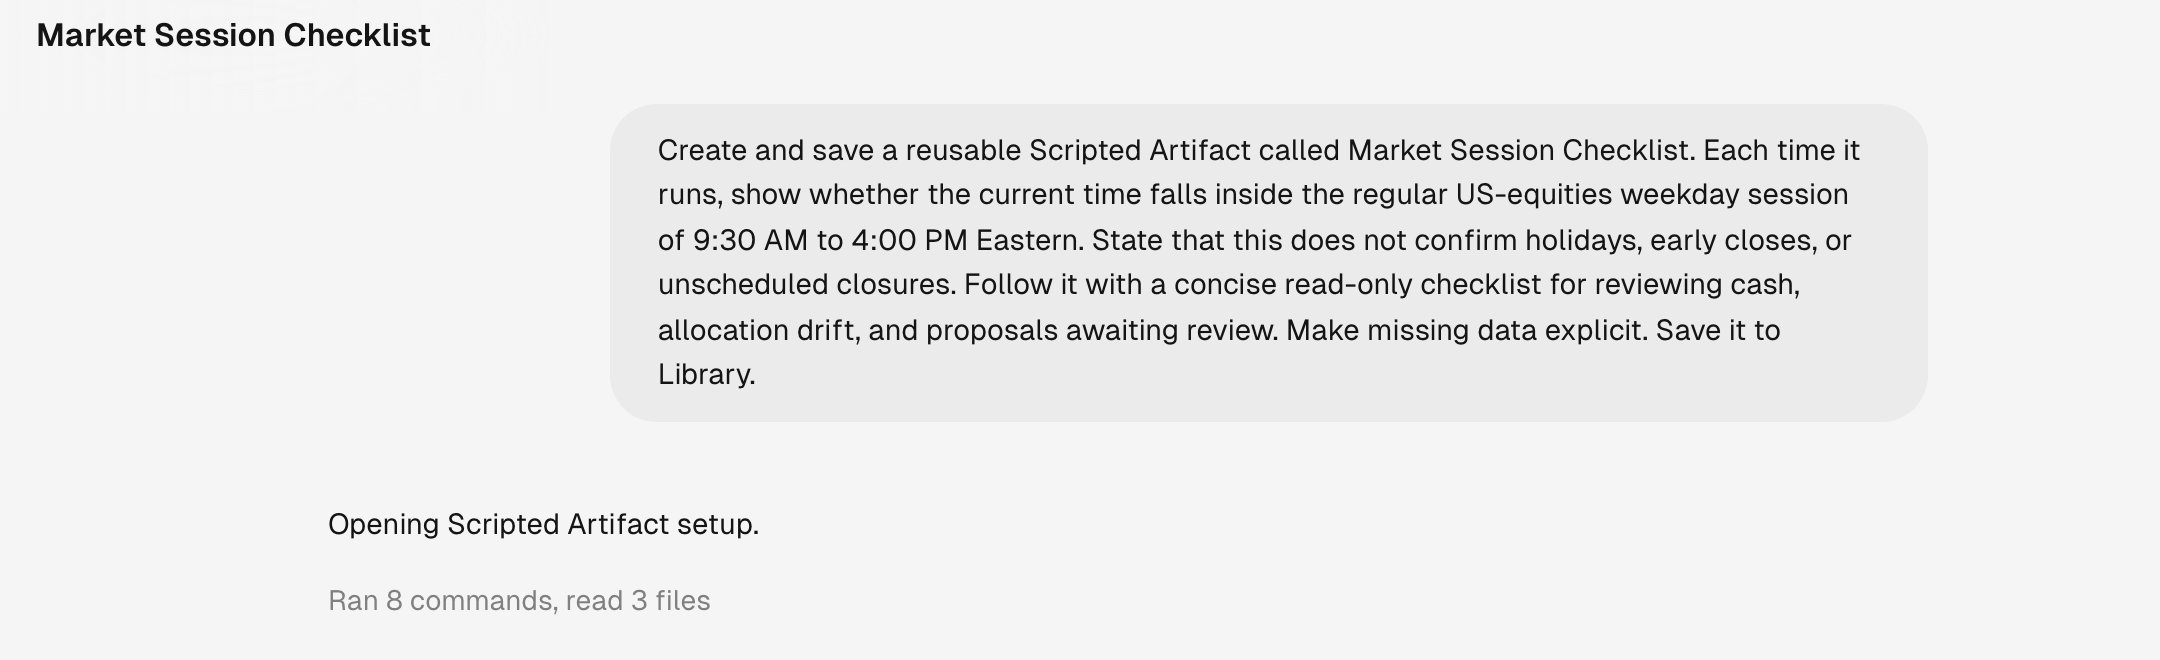 Tilt Agent builds the dashboard, runs it, and checks its output before saving it. Wait for the confirmation that it was saved to Library.
## 2. Review the dashboard
Open the dashboard from the chat or from **Library > Dashboards**. Each card shows a one-line description and when the dashboard last refreshed.
Tilt Agent builds the dashboard, runs it, and checks its output before saving it. Wait for the confirmation that it was saved to Library.
## 2. Review the dashboard
Open the dashboard from the chat or from **Library > Dashboards**. Each card shows a one-line description and when the dashboard last refreshed.
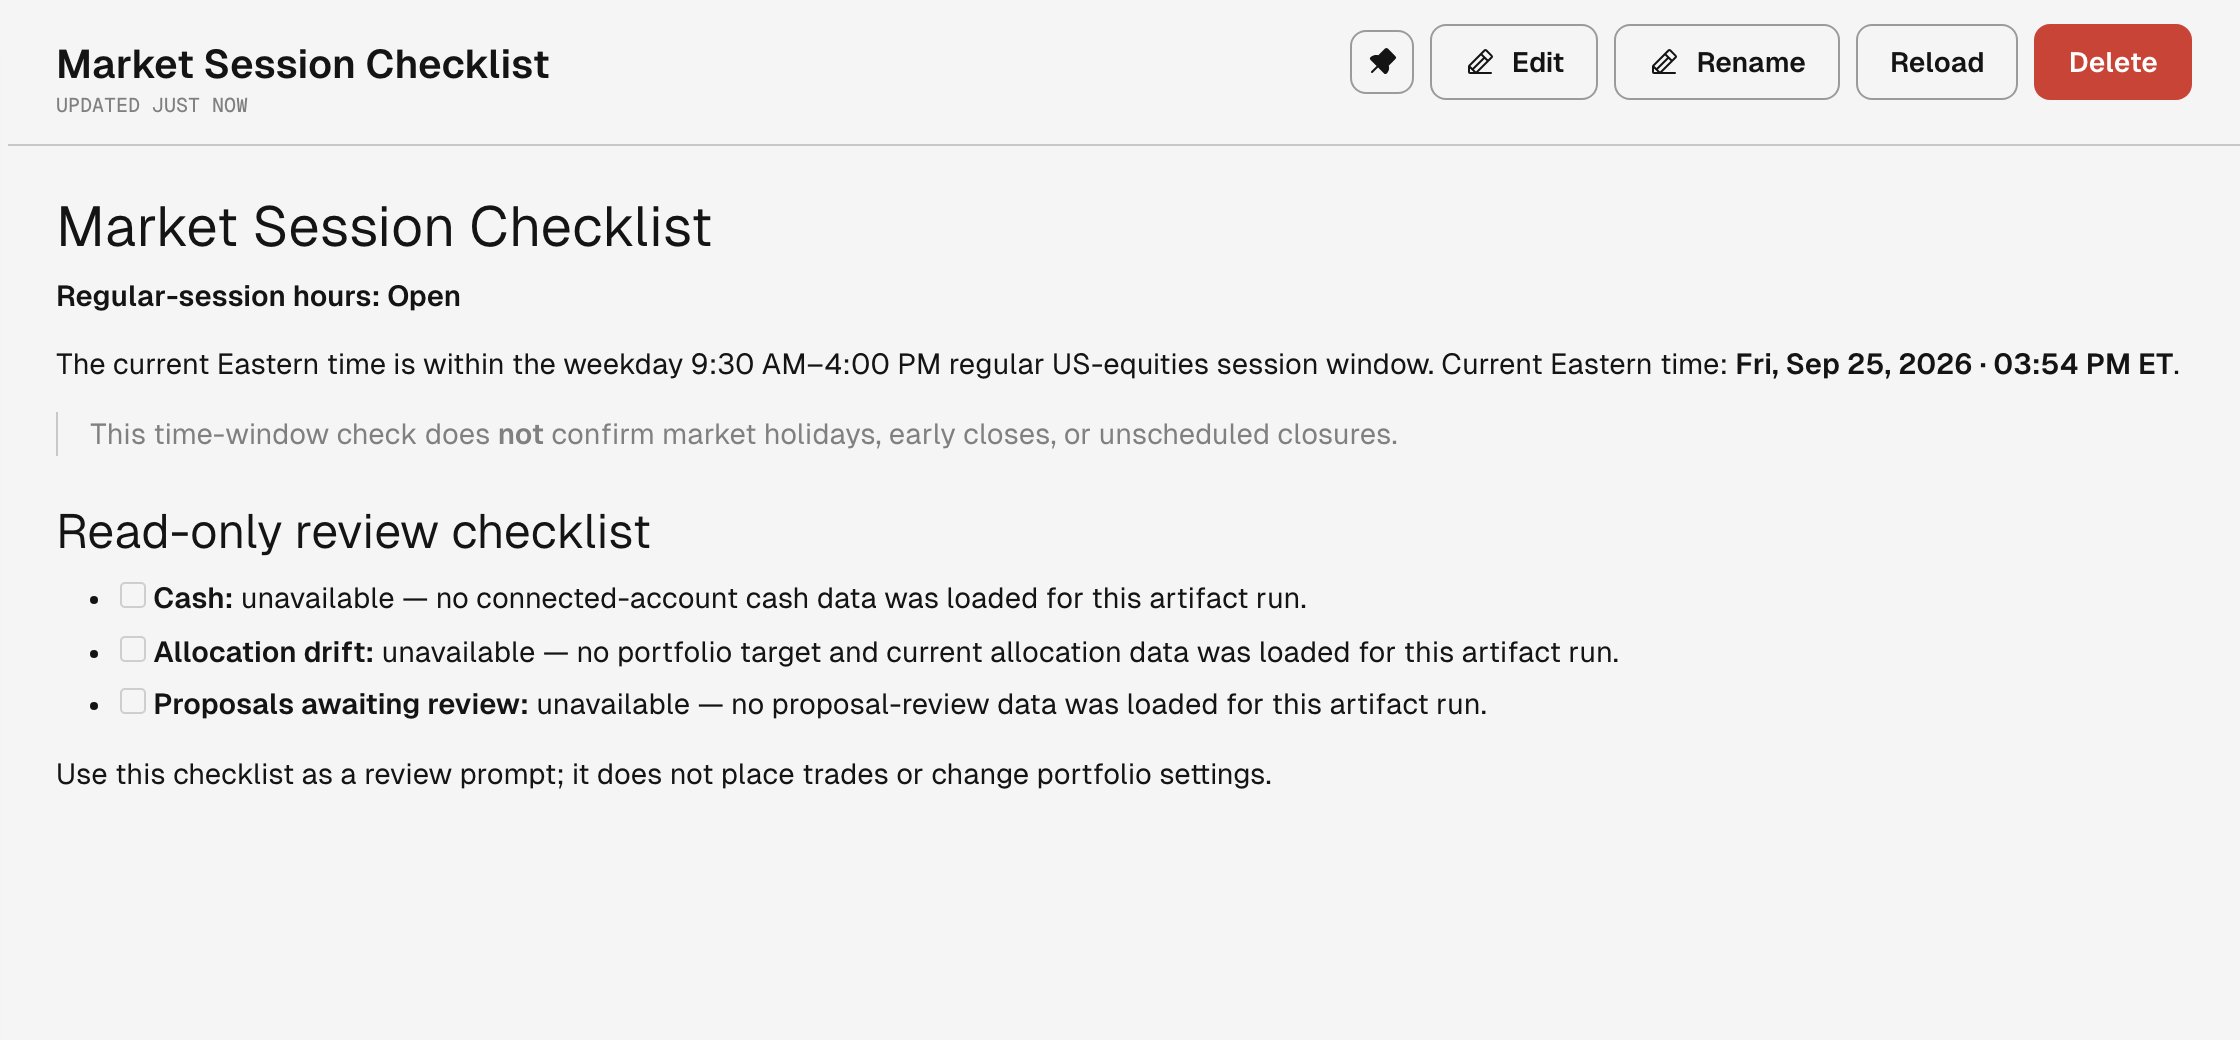 The example has no connected portfolio data, so it labels each unavailable input instead of inventing a result.
## 3. Open it again
Opening a dashboard runs it again. If it ran in the last few minutes, the header shows how old the data is; select **Reload** to run it now. Use **Edit** to ask Tilt Agent to change the dashboard, or **Rename** to change its title.
Ask for another dashboard when the new view answers a different question. Keep each dashboard focused on one recurring question.
## Starters
**Library > Dashboards** also lists starters: ready-made dashboards that fit your account, such as **Advisor Dashboard** in an organization you advise. Select **Open** to add your copy. A starter leaves the list once you have opened it.
This documentation is built and hosted on [Mintlify](https://mintlify.com), a developer documentation platform.
The example has no connected portfolio data, so it labels each unavailable input instead of inventing a result.
## 3. Open it again
Opening a dashboard runs it again. If it ran in the last few minutes, the header shows how old the data is; select **Reload** to run it now. Use **Edit** to ask Tilt Agent to change the dashboard, or **Rename** to change its title.
Ask for another dashboard when the new view answers a different question. Keep each dashboard focused on one recurring question.
## Starters
**Library > Dashboards** also lists starters: ready-made dashboards that fit your account, such as **Advisor Dashboard** in an organization you advise. Select **Open** to add your copy. A starter leaves the list once you have opened it.
This documentation is built and hosted on [Mintlify](https://mintlify.com), a developer documentation platform.